League predictions and league maths
Leagues are not interchangeable. The Premier League draws least of the nine domestic competitions we model and the Brasileirão draws most; Serie A gives the home side the least and the Bundesliga produces three quarters of a goal more per match than Brazil. Those differences decide how a model behaves and how far a record built in one league transfers to another. These posts cover each competition on its own terms, and the table arithmetic that goes with them — what 40 points really buys, what a game in hand is worth, and how tiebreakers are actually resolved.
17 articles
How many points do you need to win the Premier League?
How many points to win the Premier League is a percentile question, not a threshold. Here is how match probabilities turn into a title-winning total.
LeaguesThe 40-point rule: does 40 points really keep you up?
The 40-point rule is football's most durable number. Testing it against how relegation actually works — and why survival is a probability, not a target.
LeaguesHow many points do you need to avoid relegation?
How many points to avoid relegation is the wrong question — the safety line is a distribution set by other clubs. Here is how to read it as a probability.
LeaguesChampions League prediction model explained: why it isn't the league model
A champions league prediction model can't reuse a domestic one. Why thirty-six clubs from fifteen leagues break the usual method, the ways a model can bridge leagues, and how to judge any of them.
LeaguesChampions League league phase predictions: 36 teams, one table, unequal fixtures
Champions League league phase predictions can't use normal table logic — each club plays 8 of 35 rivals. How strength of schedule and simulation fix it.
LeaguesWhich football league is easiest to predict?
Most answers to this are opinion — MLS, Ligue 1, Scotland. We measured it instead, using the closing market's own record across nine leagues and 16,628 matches.
LeaguesBrasileirão predictions: the tightest of the top leagues
Brazil's Série A draws more, scores less and defends home ground harder than any of the nine leagues in our dataset. Here's what that does to a prediction.
Leagues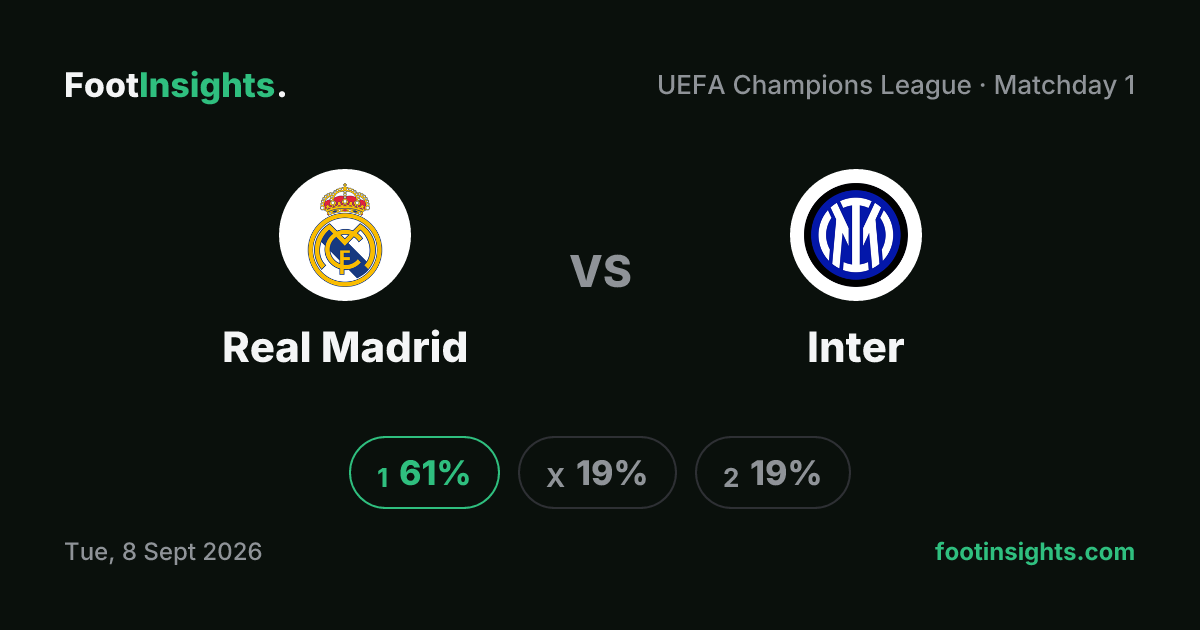
Champions League 2026-27 draw: what the fixture computer handed each club
The Champions League 2026-27 league phase draw in numbers: 144 fixtures, a 99% favourite, one true coin flip, and the model's first read on matchday 1.
LeaguesEuropa League 2026-27 draw: the league phase, now tracked on FootInsights
The Europa League 2026-27 league phase draw: 36 clubs, 144 fixtures from 16 September to 28 January — and why our predictions for it arrive only after calibration.
LeaguesBundesliga predictions: the league where the result tells you least
The Bundesliga leads our data in goals, Over 2.5 and BTTS while its 1X2 split is dead average. That combination decides where a German prediction is worth having.
LeaguesChampionship predictions: the league where the table lies
The Championship has the tightest margins of any competition in our top-league dataset — just 12.2% end by three goals or more — across a 46-game season. Compression is the whole story.
LeaguesEredivisie predictions: the goals come from mismatches
The Eredivisie is the second-highest scoring league in our top-league dataset and has the highest blowout rate of any domestic competition in it — 21.6%. Those two facts are the same fact.
LeaguesLa Liga predictions: home sides rarely lose, and rarely by much
La Liga has Europe's strongest home advantage and its narrowest margins: 72.0% of matches end home or draw, and only 13.1% by three goals or more.
LeaguesLigue 1 predictions: the league whose reputation the data will not support
Ligue 1 is not the league of blowouts its reputation claims: 15.3% end by three or more, below England and Germany. What the data says instead.
LeaguesPremier League predictions: the league that refuses to draw
The Premier League draws less than any competition in our top-league dataset — 23.8%. What that does to double chance, to promoted clubs, and to the sharpest odds in football.
LeaguesPrimeira Liga predictions: the league where goals are not shared
Portugal is the only domestic league in our top-league dataset where 1-0 is the most common scoreline, and it has the lowest BTTS rate at 49.1%. One side scores; the other does not.
LeaguesSerie A predictions: the league that gives the home side least
Serie A has the weakest home advantage of any competition in our top-league dataset — a 7.8-point gap — and Europe's highest draw rate. What that does to a prediction, and why.