Blog — page 5
How prediction models actually work, what betting markets really price, and how to judge anyone's tips — including ours, whose track record is public.
La Liga predictions: home sides rarely lose, and rarely by much
La Liga has Europe's strongest home advantage and its narrowest margins: 72.0% of matches end home or draw, and only 13.1% by three goals or more.
LeaguesLigue 1 predictions: the league whose reputation the data will not support
Ligue 1 is not the league of blowouts its reputation claims: 15.3% end by three or more, below England and Germany. What the data says instead.
Match preview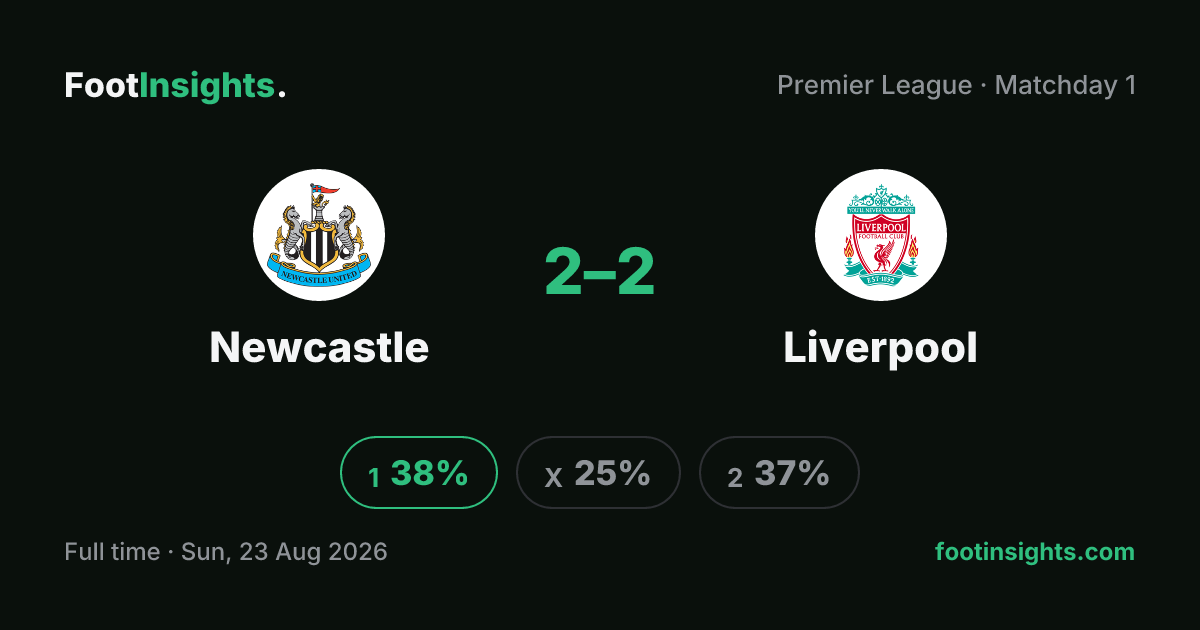
Newcastle vs Liverpool: the tightest call of opening weekend
Liverpool have won four of the last five meetings, yet our model makes the Premier League opener at St James' Park a statistical coin flip. Here's why.
LeaguesPremier League predictions: the league that refuses to draw
The Premier League draws less than any competition we model — 23.8%. What that does to double chance, to promoted clubs, and to the sharpest odds in football.
LeaguesPrimeira Liga predictions: the league where goals are not shared
Portugal is the only domestic league we model where 1-0 is the most common scoreline, and it has the lowest BTTS rate at 49.1%. One side scores; the other does not.
LeaguesSerie A predictions: the league that gives the home side least
Serie A has the weakest home advantage of any competition we model — a 7.8-point gap — and Europe's highest draw rate. What that does to a prediction, and why.
ModelWhat is expected goals (xG)? The metric, its power and its limits
How xG turns shots into probabilities, what it genuinely fixes, the trap in reading an xG total — and what it adds to a forecast once the odds are known.
TransparencyThe Brier score: how to judge a football prediction model
Accuracy alone cannot tell a good predictor from a lucky one. The Brier score can — how it works, what good values look like in football, and how to read one honestly.
Betting 101Both teams to score (BTTS): a probability guide
What drives BTTS, why it is not Over/Under in disguise, and how to price it from a scoreline grid — with base rates from 17,495 matches across ten competitions.
ModelHow football prediction algorithms actually work
Ratings, Poisson goals and probabilities — what is really inside a football prediction model, explained without hype by a team that publishes its own results.
Betting 101Over/Under 2.5 goals: what the market really prices
Why 2.5 is the line, what actually drives totals, and how a goal model prices Over/Under — with base rates from 17,495 matches and the spread across ten competitions.
ModelThe Poisson distribution in football, explained with real numbers
Why one 19th-century formula still powers most football prediction models — how it works, how well it actually fits 17,495 matches, and where it needs help.
TransparencyWhy most 'value bets' aren't: closing odds and market efficiency
Most value bets are a model's own miscalibration wearing a discount. What closing line value actually measures, why closing odds are so hard to beat, and how ours are held to it.